Official data · Pakistan Bureau of Statistics · State Bank of Pakistan
Inflation in Pakistan
The latest consumer price inflation rate in Pakistan, the full monthly series since July 1990, and how it sits against the State Bank's 5–7% target. One permanent URL, updated after every official release, with the chart and the data free to reuse.
Next release: November 2026 CPI — Pakistan Bureau of Statistics, monthly, date set by the agency (PBS normally publishes on the first working day of the following month).
Latest inflation published
9.6%
year on year · October 2026
Published by the Pakistan Bureau of Statistics on 2 November 2026. Down from 10.3% in September 2026; a year earlier it was 6.2%. See the PBS release
Above the 5–7% target band · 8 months in a row
Month on month
+1.1%
change from Sep 2026
Fiscal year to date
+4.8%
price change since June (FY runs Jul–Jun)
12-month average
8.8%
last 12 months vs the 12 before
CPI index (2015-16 = 100)
307.6
October 2026
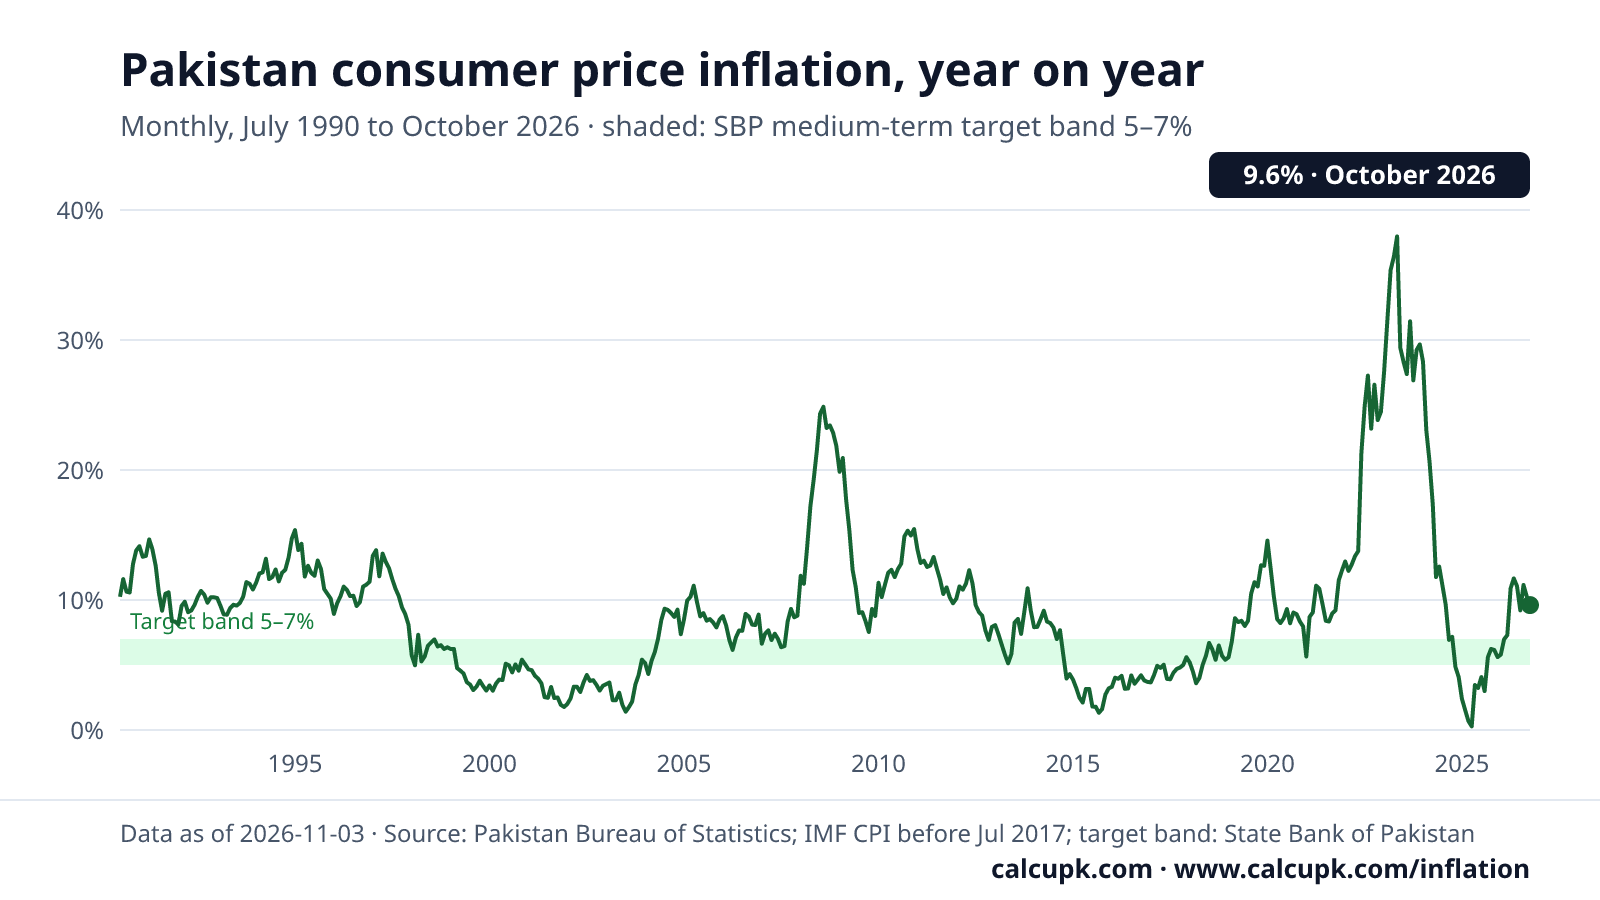
Inflation since 1990, against the target band
Pakistan · consumer price inflation, year on year · Jul 1990 – Oct 2026Source: PBS (IMF CPI before Jul 2017) · band: SBP
How to read it: the shaded strip is the State Bank's medium-term target band of 5–7%. The target is the band, so a reading of 8% is outside it, not "close to target".
Data licensed CC BY 4.0 — reuse freely with credit to calcupk.com. The image already contains title, series and source.
Key facts
Computed from the series · data to October 2026
- Inflation has been above the 5–7% target band for 8 consecutive months, since March 2026.
- The highest reading in the last 10 years was 38.0% in May 2023; the lowest was 0.3% in April 2025.
- Prices are up 208% since July 2015: what cost Rs 1,000 then costs about Rs 3,080 in October 2026.
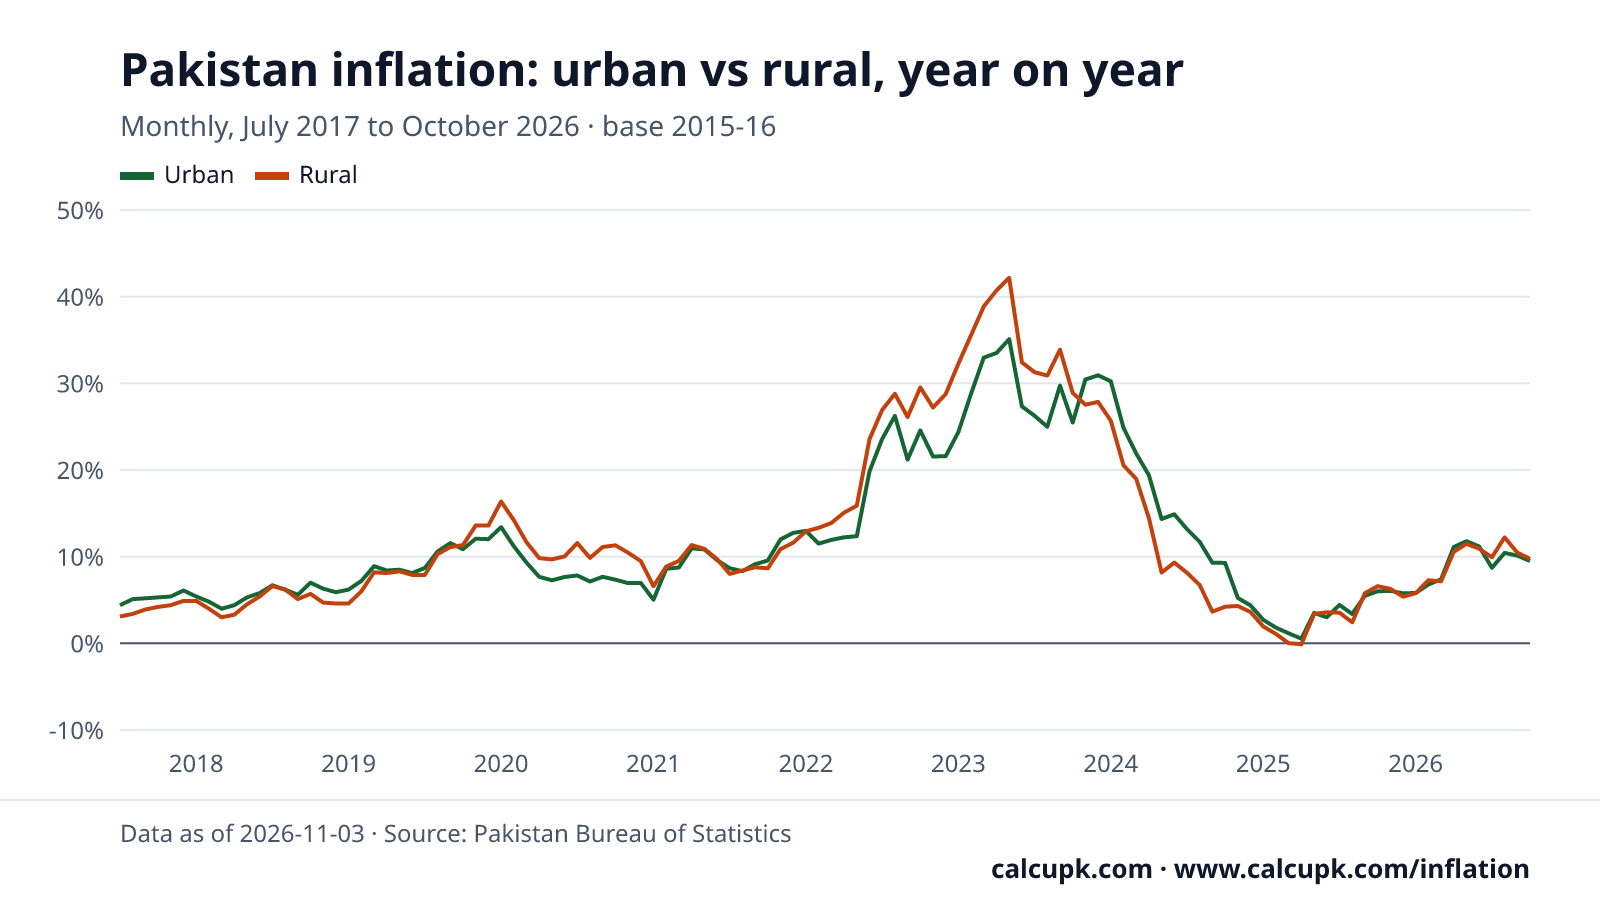
- Rural inflation ran above urban inflation in 6 of the last 12 months.
- Core inflation (non-food non-energy, urban) was 7.8% in October 2026, below the headline rate of 9.6%.
Urban vs rural inflation in Pakistan
Year on year · Jul 2017 – Oct 2026 · base 2015-16
Data licensed CC BY 4.0 — reuse freely with credit to calcupk.com. The image already contains title, series and source.
Pakistan inflation: last 24 months
| Month | Year on year | Month on month | Urban | Rural | Core (NFNE) |
|---|---|---|---|---|---|
| Oct 2026 | 9.6% | +1.1% | 9.5% | 9.8% | 7.8% |
| Sep 2026 | 10.3% | +1.3% | 10.1% | 10.5% | 8.6% |
| Aug 2026 | 11.2% | +1.2% | 10.4% | 12.2% | 8.8% |
| Jul 2026 | 9.2% | +1.2% | 8.7% | 9.9% | 8.6% |
| Jun 2026 | 11.1% | −0.3% | 11.2% | 10.9% | 8.7% |
| May 2026 | 11.7% | +0.5% | 11.8% | 11.5% | 9.0% |
| Apr 2026 | 10.9% | +2.5% | 11.1% | 10.6% | 8.0% |
| Mar 2026 | 7.3% | +1.2% | 7.4% | 7.2% | 7.4% |
| Feb 2026 | 7.0% | +0.3% | 6.8% | 7.3% | 7.1% |
| Jan 2026 | 5.8% | +0.4% | 5.8% | 5.8% | 7.2% |
| Dec 2025 | 5.6% | −0.4% | 5.8% | 5.4% | 6.9% |
| Nov 2025 | 6.2% | +0.4% | 6.0% | 6.3% | 6.6% |
| Oct 2025 | 6.2% | +1.7% | 6.0% | 6.6% | 7.5% |
| Sep 2025 | 5.6% | +2.1% | 5.5% | 5.8% | 7.0% |
| Aug 2025 | 3.0% | −0.6% | 3.4% | 2.4% | 6.9% |
| Jul 2025 | 4.1% | +2.9% | 4.4% | 3.5% | 7.0% |
| Jun 2025 | 3.2% | +0.2% | 3.0% | 3.6% | 6.9% |
| May 2025 | 3.5% | −0.2% | 3.5% | 3.4% | 7.3% |
| Apr 2025 | 0.3% | −0.8% | 0.5% | -0.1% | 7.4% |
| Mar 2025 | 0.7% | +0.9% | 1.2% | 0.0% | 8.2% |
| Feb 2025 | 1.5% | −0.8% | 1.8% | 1.1% | 7.8% |
| Jan 2025 | 2.4% | +0.2% | 2.7% | 1.9% | 7.8% |
| Dec 2024 | 4.1% | +0.1% | 4.4% | 3.6% | 8.1% |
| Nov 2024 | 4.9% | +0.5% | 5.2% | 4.3% | 8.9% |
Core is the non-food non-energy measure for the urban basket. A dash means the agency has not published that figure for the month.
What your money is worth
had the buying power of
Rs 45,060
in October 2026
and Rs 10,000 in October 2026 buys what cost
Rs 2,220
in 2010
Computed from the chained national CPI index (2015-16 = 100): 2010 average against October 2026. It describes the average basket, not any one product.
What inflation looks like in one bill: see how a household's electricity bill has moved in rupees paid and in today's rupees.
Annual inflation in Pakistan by fiscal year
Average CPI for the fiscal year (July–June) against the previous year's average.
| FY 2025-26 | 7.0% |
| FY 2024-25 | 4.5% |
| FY 2023-24 | 23.4% |
| FY 2022-23 | 29.2% |
| FY 2021-22 | 12.2% |
| FY 2020-21 | 8.9% |
| FY 2019-20 | 10.8% |
| FY 2018-19 | 6.8% |
| FY 2017-18 | 3.9% |
| FY 2016-17 | 4.2% |
| FY 2015-16 | 2.9% |
| FY 2014-15 | 4.5% |
| FY 2013-14 | 8.6% |
| FY 2012-13 | 7.4% |
| FY 2011-12 | 11.0% |
| FY 2010-11 | 13.7% |
| FY 2009-10 | 10.1% |
| FY 2008-09 | 19.6% |
| FY 2007-08 | 12.0% |
| FY 2006-07 | 7.8% |
| FY 2005-06 | 7.9% |
| FY 2004-05 | 9.3% |
| FY 2003-04 | 4.6% |
| FY 2002-03 | 3.2% |
| FY 2001-02 | 2.7% |
| FY 2000-01 | 4.4% |
| FY 1999-00 | 3.6% |
| FY 1998-99 | 5.7% |
| FY 1997-98 | 7.8% |
| FY 1996-97 | 11.8% |
| FY 1995-96 | 10.8% |
| FY 1994-95 | 13.0% |
| FY 1993-94 | 11.3% |
| FY 1992-93 | 9.8% |
| FY 1991-92 | 9.4% |
How to cite and download
This URL is permanent; the data updates in place after each official release.
Suggested citation
calcupk.com. "Pakistan inflation: 9.6% in October 2026". Data: Pakistan Bureau of Statistics (IMF CPI dataset for months before July 2017), updated to October 2026. https://www.calcupk.com/inflation
The data are public. Attribute them to the Pakistan Bureau of Statistics, which compiles the CPI, and to the State Bank of Pakistan for the target band. Neither agency endorses or reviews calcupk.com.
Methodology
The monthly series is the national consumer price index rebased to 2015-16 = 100. From July 2017 it is the Pakistan Bureau of Statistics' own 2015-16 index, taken from each Monthly Review on Price Indices (and, where a review is not online, from the PBS historical indices workbook). Before that it is the IMF's spliced CPI for Pakistan, which chains the earlier PBS base years (1959-60 through 2007-08); it is scaled so that its July 2017 value equals the PBS 2015-16 value (factor 0.682712), so the two join with no break in level.
Year on year compares a month with the same month a year earlier. Where PBS publishes the rate it is used as published; otherwise it is computed from one index series only, so a ratio never mixes base years. Month on month compares with the previous month. Fiscal year to date is the price change since June (the fiscal year runs July to June). The 12-month average compares the average index of the last 12 months with the 12 before. A month counts as inside the band when the rate, to one decimal, is between 5% and 7%.
Urban and rural rates start in July 2017 and core inflation (non-food non-energy, urban basket) in January 2022, the earliest months available in the PBS files read. Nothing is estimated or interpolated: a missing month is blank in the CSV.
Official sources
- Pakistan Bureau of Statistics — Price Statistics: monthly CPI reviews, 2015-16 base.
- PBS historical indices and growth rates: national, urban and rural indices from July 2017.
- IMF CPI dataset (IMF.STA:CPI), Pakistan: spliced national index, months before July 2017.
- State Bank of Pakistan — Monetary Policy: the 5–7% medium-term target.
- World Bank — inflation, consumer prices (annual %), Pakistan: calendar years from 1960.
Questions
Change log
- 3 November 2026Page published with the chained monthly series from July 1990.